How to audit Core Web Vitals
A step-by-step procedure to identify problems and prioritize changes ahead of the Page Experience Update.
Google declared in May 2020 that Core Web Vitals would be incorporated into Google’s algorithms in 2021. But that there was “no imminent need to take action”. Google announced in November 2020 that this update will go into effect in May-June 2021. Thus now is the time for site owners and SEOs all over the world to take action on the aptly called Page Experience Update.
What are Core Web Vitals?
Core Web Vitals are a set of measures that are used to assess a website’s loading speed, interactivity, and visual consistency. All three are linked to site speed in some way. Which we’ve known for a long time to be crucial for both search engines and people.
What’s particularly intriguing about Core Web Vitals, and in particular the Page Experience Update, is that Google isn’t always open about the details of its algorithm adjustments. However, in this situation, we’ve been told the exact metrics we’ll be measuring and improving. As well as the date the change will take effect. This shows that Page Experience undoubtedly will be a critical improvement. But also one that we can realistically prepare for. As long as the auditing process is detailed and accurate. Here are the metrics that need to be analyzed in a Core Web Vitals audit:
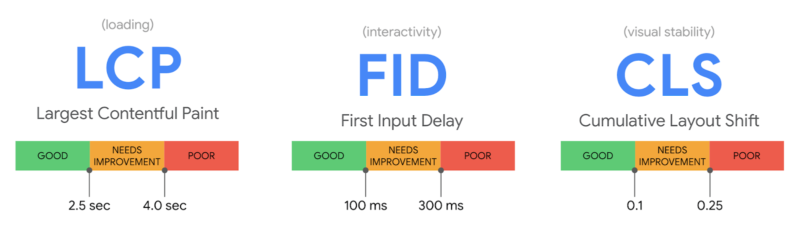
Largest Contentful Paint (LCP)
assesses the efficiency of loading (i.e., how long it takes for the largest item in the viewport to load). To avoid a “bad” score, LCP should occur within 2.5 seconds of when the page first starts loading, or no more than 4 seconds (but anything between 2.5 and 4 seconds “needs improvement”).
First Input Delay (FID)
Interactivity is measured (i.e., how long it takes for the website to respond when a user clicks on something). To avoid a “bad” score, pages should have an FID of less than 100 milliseconds or a maximum of 300 milliseconds (but anything between 100 and 300 milliseconds “requires improvement”). Because First Input Delay requires field data. A comparable metric is used in the audit method explained in this article, “Total Blocking Time (TBT),”. But this audit employs lab data because field data may not always be available for the website you are investigating.
Cumulative Layout Shift (CLS)
determines the visual stability (i.e., whether or not the page jumps around as the user scrolls through the content). To avoid a “bad” score, pages should have a CLS of less than 0.1 or a minimum of 0.25 (although anything between 0.1 and 0.25 is still “requires work”).
This audit concentrates on metrics with a “poor” score because these will be the most important areas to address, but you can also include “needs improvement” indicators. Let’s get started on the audit process now. That we know what we’re auditing.
How to audit Core Web Vitals using Screaming Frog
Knowing what Core Web Vitals are is one thing; finding a mechanism to audit and communicate Core Web Vitals issues to clients in a way that is both helpful and actionable is another. When dealing with Core Web Vitals concerns, the audit procedure I’ve put up is aimed to provide genuine facts, examples, and data to work with.
Three items are required to begin the audit:
- The Screaming Frog website crawler in a premium edition.
- A key for the PageSpeed Insights API (which you can get from this Google PageSpeed Insights documentation page).
- The website you’re auditing’s domain.
Step 1: Connect the PageSpeed Insights API key to Screaming Frog
You must first link your PageSpeed Insights API key to Screaming Frog. You’ll be able to obtain PageSpeed Insights statistics and recommendations on a page-by-page basis as a result of this. They only get a certain number of PageSpeed Insights queries each day (about 25,000), which should suffice for smaller sites, but for larger sites, you’ll need to upgrade. They will be able to apply what you’ve learned from the pages that generate the most traffic to the rest of the site.
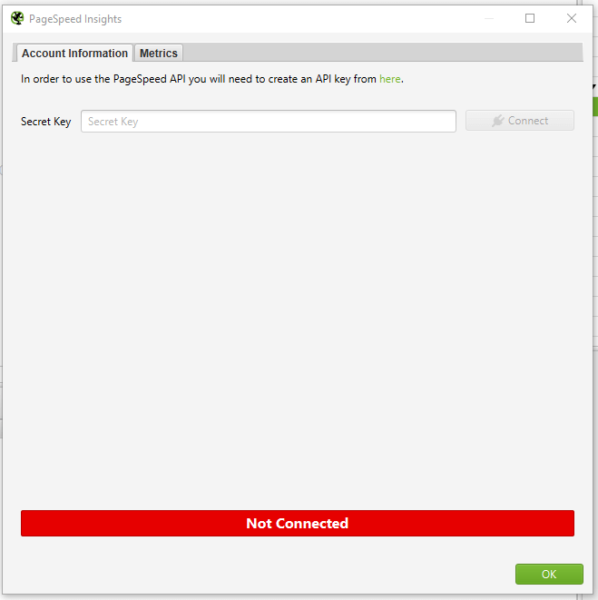
Open Screaming Frog and go to Configuration > API Access > PageSpeed Insights with your PageSpeed Insights API key in hand.
In the “Secret Key” box, paste your API key.
“Connect” should be selected.
Click on “Metrics” once you’ve joined. The metrics that will be displayed within your crawl will be defined here. I’m picking “All Metric Groups” for the purposes of this audit. But you can select only the ones you want to report on and click “OK.”
The metrics groupings provided are as follows:
Summary — Provides a high-level overview of the page, including its size and potential load savings.
Data from the Chrome User Experience Report (CrUX Metrics). If field data from real-life, opted-in users is available, it will appear here.
Lighthouse Metrics — This is where we get the majority of the lab data for the audit, including LCP, TBT, and CLS scores.
Opportunities — Offers suggestions for improving page speed on a page-by-page basis.
Diagnostics — Provides more information regarding the crawled website’s overall performance.

Step 2: Crawl the website
The next step is to begin your crawl. Copy the domain of the website you’re crawling and paste it into the “Enter URL to Spider” box at the top of the crawler. You’ll notice both a “Crawl” and an “API” progress bar in the top right-hand corner as the site gets crawled. Before you begin evaluating your data, you must wait for both of these to reach 100%.

Step 3: Report the size of the problem
Before you get into the specifics of what needs to be fixed, you must first express the scope of the issue. To do so, look at the percentage of pages that fail to meet each of the Core Web Vital’s minimal standards.
Select “PageSpeed” and then “Export” from the top navigation bar.
Find the following columns in your exported data and filter accordingly:
Filter by Largest Contentful Paint Time (ms) to identify all pages with an LCP of 4000ms or higher.
Total Blocking Time (ms) – Use this filter to locate all pages with a total blocking time of 300ms or higher.
Cumulative Layout Shift – Use this filter to locate all pages that have a CLS of 0.25 or higher.
Add this information to a separate datasheet so you or your customer can quickly see which pages fail each Core Web Vital. The percentage of pages on the site that fail each Core Web Vitals minimal criteria can then be reported. Here’s an example I recently emailed to a client:
95 percent of pages have a Largest Contentful Paint of more than 4 seconds (fail) – see the accompanying datasheet’s “LCP >4s” tab.
The Total Blocking Time on 58 percent of pages is over 300 milliseconds (fail) – see the “TBT >300ms” item in the attached datasheet for further information.
The Cumulative Layout Shift score on 93 percent of pages is over 0.25 (fail) – check the “CLS >0.25” tab in the accompanying datasheet for more information.
Now that you have a full list (or a sample list, if the site is too huge) of pages that fail to meet Core Web Vitals minimum limits, developers will know where to look for them. You can also report any patterns you observe now (e.g., it’s only blog pages, etc.).
Step 4: Report the issues specific to each page and make appropriate recommendations
This is where we turn problems into solutions during the audit. We’re aware that a certain number of pages are failing to meet Core Web Vitals’ basic standards. But what can we (or the client) do about it? This is where the PageSpeed Insights API shines the brightest.
Scroll down to “PageSpeed” under the “Overview” tab on the right-hand side. The list of issues/recommendations relating to page performance and, for the most part, Core Web Vitals may be found here.
The issues described here cover a wide range of topics. If there are any you don’t recognize, look them up on the web. dev page for further information. While the information provided by Screaming Frog and PageSpeed Insights does not provide a full list of all issues that can affect Core Web Vitals. It does aid in the overall analysis of your/your client’s site.
To see the pages affected by an issue, click on it and export them to your datasheet. You’re now reporting on the specifics of how many pages are affected by a problem, as well as the URLs of the pages that are affected. I’ve exported a list of all the pages with render-blocking resources that could be affecting LCP in the example below. I may now advise the customer to review this list and determine whether inlining, It might be conceivable to delay or remove the resources on these pages.
You’ll be able to view the “Savings” that could be realized by correcting that particular issue, either in bytes or milliseconds, for each of the recommendations you’re making. You can now sum up the potential savings for each issue. As well as the average savings that may be made per page by fixing that issue, using the exported data for each issue. So that you can make recommendations for which issues to address first based on the amount of load savings that can be achieved In the example below. The savings in both milliseconds and bytes are considerably greater for Deferring Offscreen Images than Removing Unused CSS. Hence Deferring Offscreen Images will be a higher priority.
Step 5: Report examples of the issues specific to each page
We provide a more comprehensive dataset by reporting on examples of issues related to each page. Allowing the client/developers to immediately grasp what the issue is and whether it is something that can be resolved or not.
Following on from the last example of render-blocking resources. Select one of the URLs that is affected by this problem and click the “PageSpeed Details” button in the bottom navigation bar. The page speed information relevant to the selected page will now be displayed in the bottom left panel. Go to Opportunities > Render Blocking Resources > Remove Render Blocking Resources.
You may now view the URLs of render-blocking resources on that page. Their size (in bytes), and the potential page load savings (in milliseconds) if these render-blocking resources are removed in the bottom-right panel.
Unfortunately, you won’t be able to export these exact concerns in bulk (as far as I know), but you can copy and paste a few instances into your datasheet and search for patterns again. The same materials will frequently exist on many pages/every page of the site, allowing for site-wide application of learnings.
After you’ve gathered this information for each issue on the site. You may write a report with recommendations for each issue in priority order, referencing the information in your datasheet.
Step 6: Once changes have been made, crawl the site again and compare
Because some of the concerns will take time to rectify, the sooner you complete this audit, the better. After you’ve resolved the issues, go back to step one and re-visit the site to check how things have changed. This is where your percentages of pages that do not satisfy Core Web Vitals’ minimum requirements will be useful. As it demonstrates a quick and simple technique to determine whether your adjustments had the desired effect or not.
When I tell clients about Core Web Vitals and the Page Experience Update. One of the most common questions I get is about how this update will affect rankings. Despite the fact that this is a critical update. I don’t think websites that don’t meet the basic requirements will notice a significant decline in rankings overnight. It’s more likely that sites with exceptional content that meets or exceeds Core Web Vitals minimum requirements will see a little boost in rankings, which will, of course, cause minor decreases in rankings for the competitors they pass. This viewpoint is backed up by Google’s own policies on the subject:
“While all aspects of page experience are important. We will favor pages that provide the most useful information overall. Even if certain parts of the page experience are lacking. The importance of having exceptional, relevant content does not outweigh the need for having a decent page experience. Page experience becomes significantly more crucial for visibility in Search in scenarios where there are several pages with comparable content.”
Site owners who satisfy the minimum standards gain a significant benefit in terms of search visibility, and while we can’t anticipate exactly what will happen on the day the Page Experience Update goes live. This audit procedure will assist you in getting ready.
The post How to audit Core Web Vitals appeared first on Soft Trending.
from Soft Trending https://ift.tt/3jl2olb
via softtrending

Comments
Post a Comment